


The leadership / logistics BI analyst builds the board the committee uses to decide cost, service, and capacity. If milestones are born in WhatsApp and month-end Excel, the dashboard is theater.
The useful change is live KPIs from executed work: the agent closes operating routine; the analyst detects, reviews, and intervenes on anomalies and trade-offs.
- OTIF · cost · coverage · alerts
- KPIs
- one truth for ops and leadership
- 1 ID
- measured lane (OCL pattern)
- 6-8 wks
- your team explains; data born from the trip
- Anomalies
The problem: BI as spreadsheet archaeology
The committee asks: can we take more volume? Where is money leaking? Which carrier breaks OTIF? If the answer takes three days of Excel cleanup, the decision already arrived late.
- OTIF calculated with milestones captured late.
- Freight cost without 100% invoice matching.
- Rival versions across tower, CS, and finance.
- The analyst spends the week building the close, not explaining trade-offs.
A typical day for a logistics BI analyst
Committee week starts by requesting extracts from tower, CS, and AP. Each area sends its version. The analyst cleans, matches, and dresses the board.
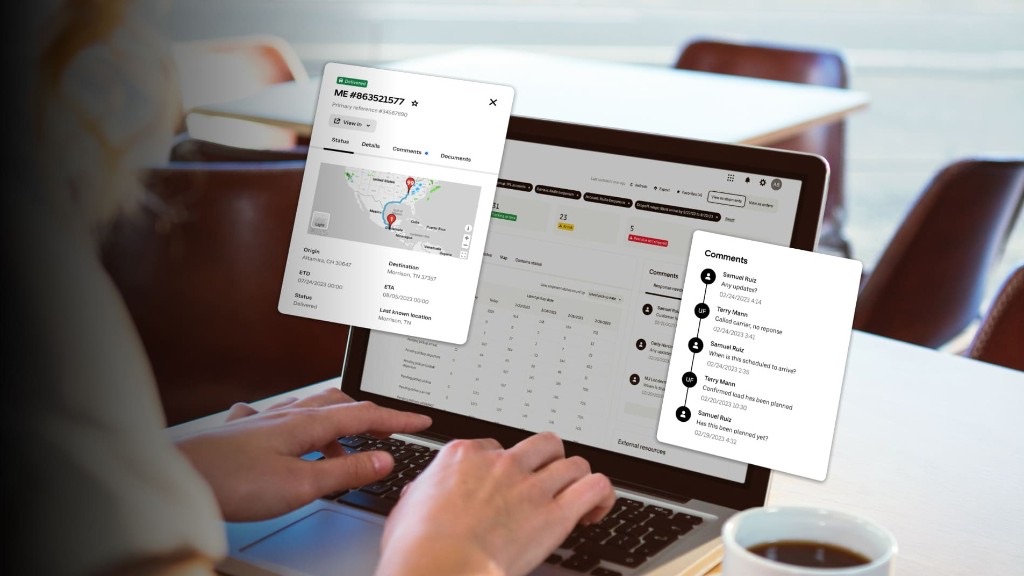
On meeting day, KPIs look green. In operations, status still lives in WhatsApp. Leadership decides volume on faith, not on a file.
- Archaeology of sheets and late screenshots.
- OTIF and cost that do not match across teams.
- Little time to explain real anomalies.
- More volume = more manual cleanup next month.
Before vs now with OCL
Automating for BI is not another BI connector. It is closing ops first so the KPI is born from the executed trip, and leaving the analyst the anomalies.
BI analyst / leadership
From cleaning Excel to KPIs from the executed trip
Before
1.Request extracts
Tower, CS, and AP diverge
2.Clean Excel
Days of manual matching
3.Fragile board
Green KPIs, late milestones
With OCL
1.File milestones
GPS, POD, audit on one ID
2.Live board
OTIF, cost, real alerts
3.Anomalies to leadership
Explain, do not clean cells
What your team reviews
OTIF anomalies, cost leakage, saturated lanes.
BI translates a real file so leadership can decide.
- Minimum board: what is a logistics KPI.
- Service: OTIF with real milestones.
- Money: coverage of pre-pay audit.
Impact: time, volume, and satisfaction
Leadership can accept more shipments when it sees real capacity: exceptions by lane, hours freed in tower/AP, and audit coverage.
Role impact
Time · Volume · Satisfaction
Illustrative patterns · 6-8 wk pilot
Time
Hours freed from board-building
Volume
One truth for more trips
Satisfaction
Fewer “which number” fights
BI adds value when the KPI is born from the file.
Your team stays with the exceptions
Any issue can still be detected, reviewed, and acted on. The analyst does not lose control: they gain time to explain anomalies and trade-offs.
The agent (via ops) closes assignment, GPS, POD, and audit. BI supervises lane truth and brings the committee what does not balance: broken OTIF, cost leakage, saturated lane.
- Your team: anomalies, capacity, and volume decision.
- Agent / automated ops: milestones and coverage that feed the KPI.
- Result: same analysis team, more truth per shipment.
What you get in 6-8 weeks
A measured lane for leadership makes clear which KPIs are born from the file and which anomalies the analyst explains. You leave with evidence to decide volume.
6-8 week pilot
Four deliverables. One decision.
Deliverable 1
Baseline
- OTIF and cost
- % audited
- Board-build hours
Deliverable 2
OCL vs manual capture
- Ops closes milestones
- Analyst explains
Deliverable 3
Deltas
- Less Excel
- One truth
- Fewer number fights
Deliverable 4
Week 6-8 decision
- Expand
- Adjust
- Stop
OCL pattern · KPIs born from the file.
Key takeaways5 points
- Leadership does not need more screens; it needs freight KPIs born from the shipment file.
- If tower, CS, and AP capture by hand, the dashboard consolidates delay and makeup.
- Automating flows (assign, GPS, POD, audit) is what makes the board credible.
- The BI analyst leaves heroic closes and moves to explaining exceptions and trade-offs.
- Illustrative patterns and OCL canon (6-8 weeks; 5-7% auditing 100% of a pilot). No invented Promologistics KPIs.
Is your dashboard born from the trip or from month-end Excel?
Related reading
Frequently asked questions
A useful minimum board: lane OTIF, cost per trip/kg, % of invoices audited before pay, minutes to a useful GPS alert, and hours of manual capture. Avoid dashboard theater. See logistics KPI.
Because milestones are captured late or by hand. The indicator looks green while ops still lives in WhatsApp. That is fake digitization.
No. Any issue can still be detected, reviewed, and acted on. OCL closes operating work (assign, GPS, POD, audit) so the data is born from the file; the analyst explains exceptions and trade-offs.
Same shipment ID: tower feeds exceptions, CS feeds service, AP feeds the pre-pay match. Without that, BI consolidates rival versions of the truth.
You can cite OCL patterns (6-8 week pilot, 5-7% auditing 100% of a pilot) and the live-ops partnership with Promologistics. Do not invent client-internal KPIs.