

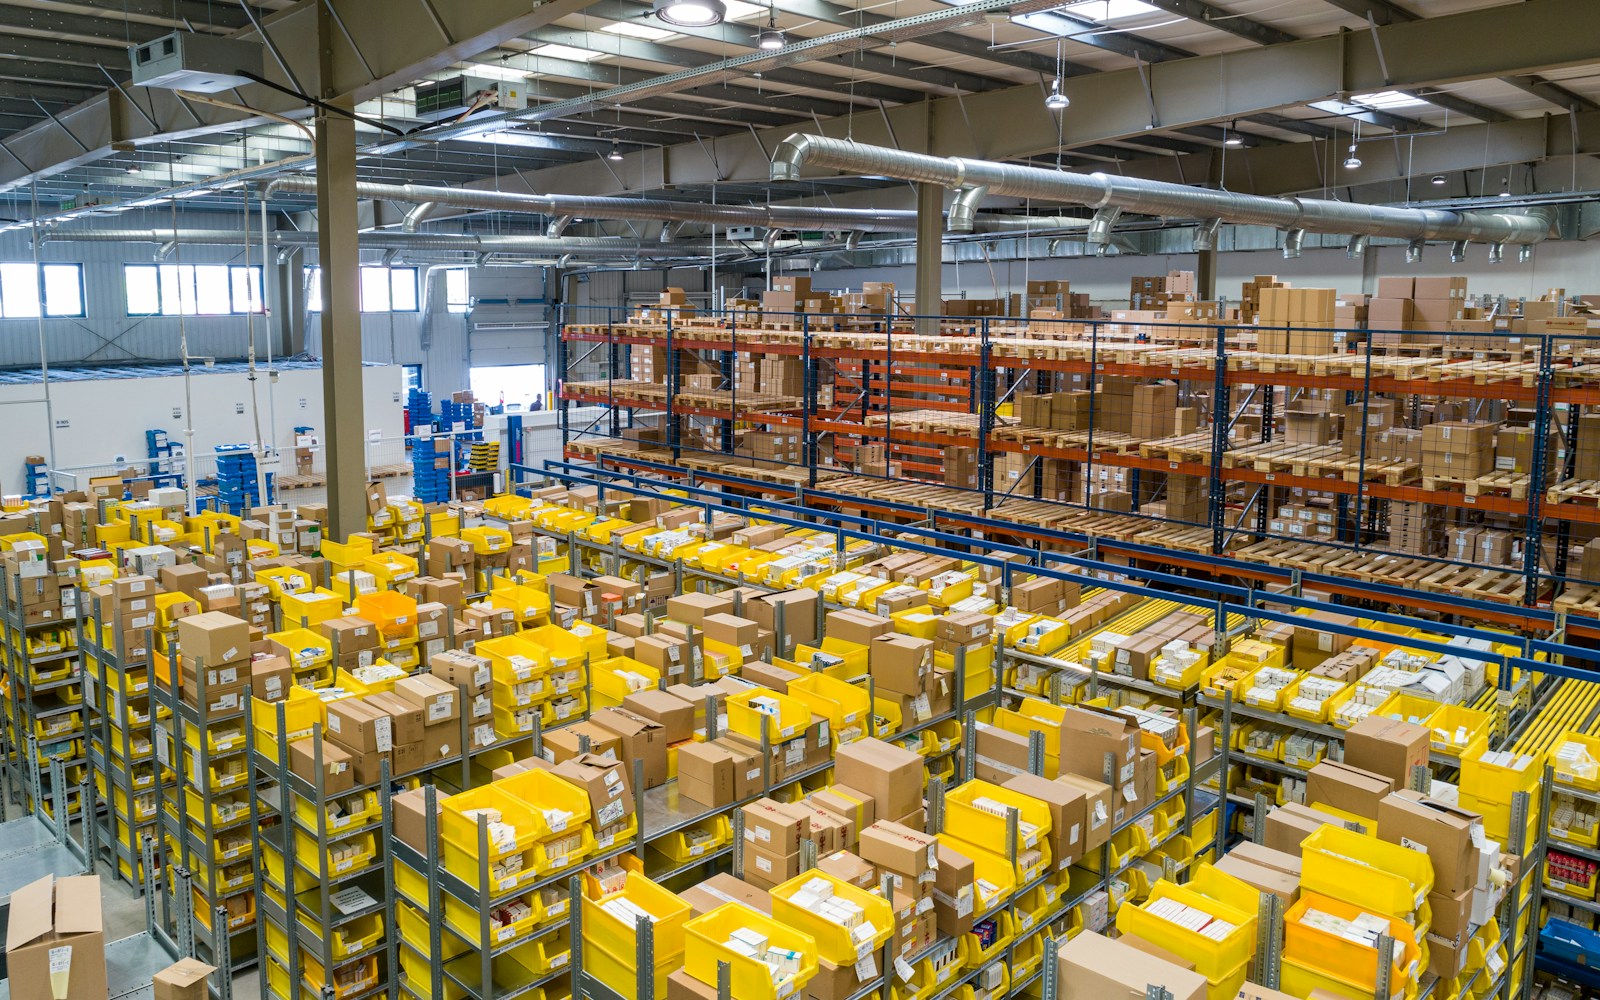
Fill rate is the completeness indicator that measures what share of demand —lines, units, or orders— is satisfied with available inventory or flow in a period. By itself it does not include punctuality: that belongs to OTD (On Time Delivery) and the AND of OTIF (On Time In Full).
If the dashboard celebrates 97% fill rate and 96% on-time “averaged,” the customer who receives late or incomplete does not celebrate: they live the AND. This guide covers formula, variants, the matrix vs OTIF/OTD, and Mexico context from the 4th National Logistics Indicators Study 2026.
- delivery fill rate (National Study 2026 sample)
- ~93%
- typical sector range (press coverage)
- ~93–96%
- OTIF ≠ average of OT + fill
- AND
- order, line, or case — do not mix
- 1 unit
Cluster: distribution KPIs · OTIF · OTD · perfect order · what a logistics KPI is.
What fill rate is (usable answer)
In Mexican operations, fill rate answers: of what the customer ordered in the period, what percentage was fulfilled complete under the In Full rule you published? It is a key performance indicator (KPI) of availability and fulfillment — inventory, picking, and partials policy — not an appointment clock.
- Demand fulfilled
- Pieces, lines, or orders that met the In Full rule in the period.
- Demand requested
- The full universe (include hard backorders; do not pull them from the denominator).
- Unit
- Customer order, line, or case. Declare it on the report.
Example:100 orders, 97 with all lines complete to order fill 97%. If you measure lines, you might see 99% because failures concentrate in a few orders. The “prettier” number is not the most useful for the customer.
Line fill, order fill, and case fill
Three common variants. Picking the wrong unit (or changing it by month) is the fastest way to make plant or 3PL reports incomparable.
Order fill
What it counts: 100% complete order
When it helps: Customer scorecard / SLA
Risk: Stricter; hurts more
Line fill
What it counts: Lines fulfilled / lines ordered
When it helps: Inventory and picking diagnosis
Risk: Hides “almost” broken orders
Case / unit fill
What it counts: Cases or pieces fulfilled
When it helps: DC and retail by volume
Risk: Not equal to a perfect order
Fill rate vs OTIF vs OTD vs perfect order
Each metric has a job. Averaging them is the OR error that inflates perceived service by 5–15 points in real operations.
Measures: Completeness (In Full)
Ignores if used alone: Late delivery
Typical use: Inventory / fulfillment
Measures: Punctuality (On Time)
Ignores if used alone: Incomplete order
Typical use: Appointments, network, transport
Measures: On time AND complete (AND)
Ignores if used alone: Damage / docs (by definition)
Typical use: Customer scorecard
Measures: OTIF + damage-free + accurate docs (typical definition)
Ignores if used alone: —
Typical use: Frictionless service
A
On Time: Yes
In Full: Yes
Fill (order): 1
OTIF (AND): 1
False OR: 1
B
On Time: Yes
In Full: No
Fill (order): 0
OTIF (AND): 0
False OR: 1
C
On Time: No
In Full: Yes
Fill (order): 1
OTIF (AND): 0
False OR: 1
D
On Time: No
In Full: No
Fill (order): 0
OTIF (AND): 0
False OR: 0
Total (4)
On Time: —
In Full: —
Fill (order): 50%
OTIF (AND): 25%
False OR: 75%
Fill rate in Mexico (National Study 2026)
The 4th National Logistics Indicators Study 2026, led by #SoyLogístico Asociación, LDM, and EGADE Business School at Tecnológico de Monterrey (with Secretaría de Economía participating in this edition), consolidates data from 160+ companies (2023–2025). In study coverage, customer-delivery fill rate ranks among the strongest indicators: about ~93% average in the sample.
Press coverage of the same study places most sectors in a healthy band of roughly 93–96%, and highlights the gap between leaders (very high compliance, often cited near or above 99%) and laggards (much lower reported floors, around ~65% in some readings). Treat leaders vs laggards as a press hedge: always calibrate to your vertical, unit of measure, and service-level agreement (SLA).
For the full distribution board (service, cost, control, and cash), use the hub distribution KPIs — logistics Mexico.
How to measure fill rate without gaming
Use the same unit for fill rate, OTD, and OTIF. Publish the AND. Without an honest denominator and evidence, the percentage is decoration.
Choose unit
Order, line, or case
Define In Full
100% + SKU + condition
Lock On Time
Window and event
Compute three
Fill, OTD, OTIF
Segment causes
Stock vs transport
Mistakes that fool the board
These failures produce high KPIs and angry customers. Fix the definition before buying another dashboard.
Elige un paso para ver el detalle
Detalle del paso · 01
Do not call the OT/IF average OTIF
Raise fill rate without breaking OTIF
Inventory, wave cut-offs, and picking improve In Full. Realistic appointments, lead-time buffer, and in-transit alerts improve On Time. If you only push fill rate with late partials, OTIF falls even when the spreadsheet “looks green.”
Typical tools: stock policies, fast tendering when capacity is missing, and early exception tracking. The hybrid stack is in TMS vs OCL agents.
OCL and the trip file
OCL Cargo is an autonomous transportation management system (TMS) with agents: it unifies milestones, proof of delivery (POD), and documents in one trip file so fill rate, OTD, and OTIF can be defended — not invented in Excel. It coexists with your system of record; your team decides exceptions. When applicable, OCL can stamp invoices and Carta Porte. It does not run your warehouse management system (WMS) or guarantee a fill rate.
Key takeaways6 points
- Fill rate = (demand fulfilled ÷ demand requested) × 100: completeness, not punctuality.
- OTIF requires On Time AND In Full; fill rate is usually only the In Full side. Averaging OTD and fill rate is not OTIF.
- 4th National Study 2026 (#SoyLogístico / LDM / EGADE): customer-delivery fill rate ~93% sample average; sectors ~93–96% — calibrate to your operation.
- Always declare the unit (order, line, case). Mixing units makes plant reports incomparable.
- Raising fill rate with late partials kills OTIF. Inventory improves IF; appointments and tracking improve OT.
- Distribution board: distribution KPIs.
Is your fill rate hiding a weak OTIF?
Related reading
Frequently asked questions
No. Fill rate measures completeness (what share of demand is fulfilled). OTIF (On Time In Full) requires completeness and punctuality at once (logical AND). See what is OTIF.
The 4th National Logistics Indicators Study 2026 (#SoyLogístico / LDM / EGADE) reports customer-delivery fill rate ~93% average in its sample; sectors often run ~93–96%. Leaders vs laggards show large gaps in press coverage — calibrate to your service-level agreement (SLA) and unit of measure.
Order fill (complete order) better matches customer pain. Line fill diagnoses inventory and picking. You can report both; do not swap one for the other in bonuses or the customer scorecard.
Because the order arrives late, you measure lines while the customer lives orders, or you average punctuality and completeness (OR) as if it were OTIF. The customer feels the AND.
Indirectly: if the shipment is split, poorly reconsigned, or lacks destination evidence, In Full fails even when the warehouse fulfilled well. That is why proof of delivery (POD) and trip-ID tracking matter.
Separate causes: if In Full fails, look at inventory/picking and fill rate; if On Time fails, look at appointments, windows, and OTD. Do not automate everything at once.